Analyze Docker Image (Web UI)
This tutorial aims to show you how to scan a docker image input file using the ScanCode Web UI while introducing you to the interface’s various features.
Tip
This tutorial is intended for anyone who prefers interacting with a visual interface when working with ScanCode.io. If you prefer using the command line, you can check our command line tutorial: Analyze Codebase (Command Line).
Note
This tutorial assumes you have a current version of ScanCode.io installed locally on your machine with an access to the ScanCode Web UI. If you do not have them already, you can take a look at our Installation guide for instructions.
Requirements
We’ll assume that you have:
Installed ScanCode.io locally
Access to the web application from your preferred browser on http://localhost/ or http://localhost:8001/ if you run on a local development setup.
Tip
You can view our User Interface section for general information about the ScanCode.io Web UI.
Instructions
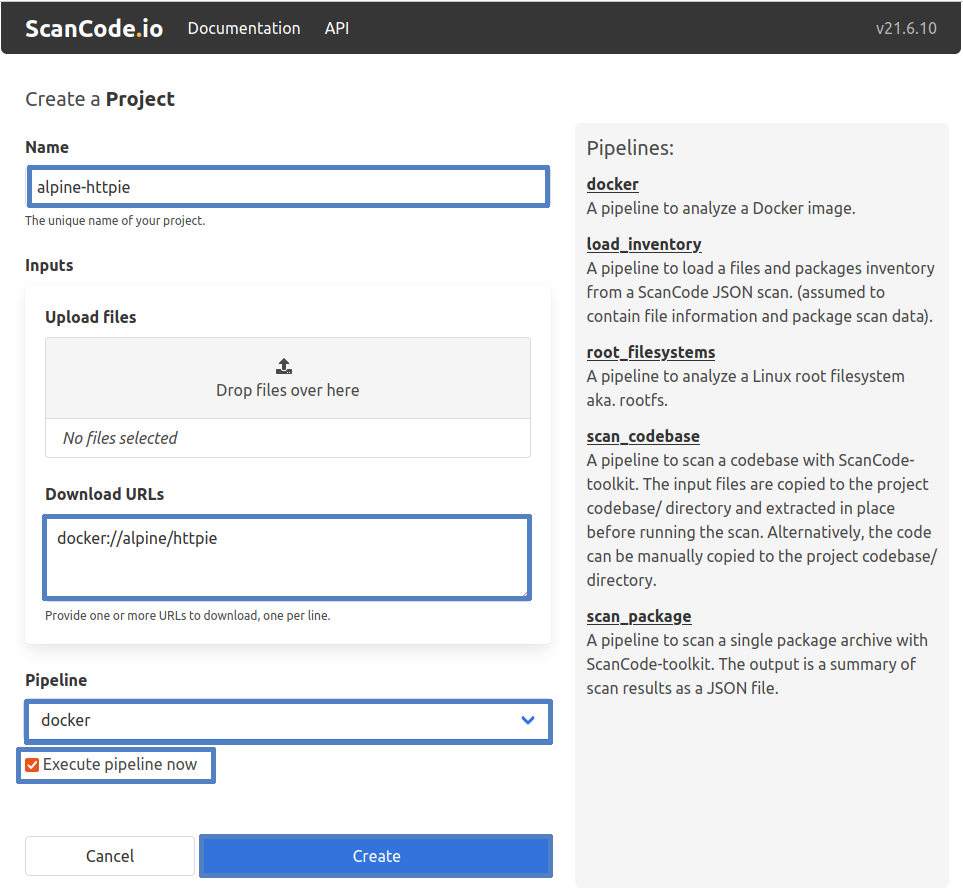
From the homepage, click on the “New Project” button to create a new project named
alpine-httpie. You will be directed to the “Create a Project” page where you need to fill in the new project’s details.Paste the input Docker image’s URL, docker://alpine/httpie, in the “Download URL” field, which fetches the image from the provided URL.
Use the “Pipeline” dropdown list, add the
analyze_docker_imagepipeline to your project.You can add and execute the
analyze_docker_imagepipeline in one operation by checking the “Execute pipeline now” checkbox.
Note
You can create a new project while leaving the Inputs and Pipeline fields blank; however, it’s required to provide a project Name!
Finally, click the “Create” button
Note
Please note that when you choose to create a new project and execute the pipeline in one operation, the process may take few minutes before it completes.
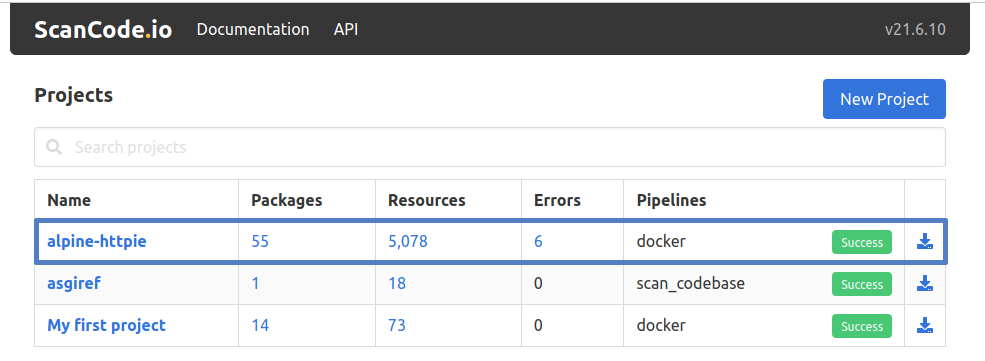
The previous screenshot shows the ScanCode.io home screen with the new “alpine-httpie” project and other existing projects. The home screen also shows a summary of the number of Packages, Code Resources, and Errors—if any—discovered during the scan process. It also contains any Pipelines used and their execution status, i.e.:
Not started
Queued
Running
Success
Failure
Plus, the ability to download the generated results in JSON and Excel (XLSX) file formats, covered in Output Files.
Tip
Refer to the complementary Review Scan Results (Web UI) page, to understand this tutorial’s scan results/output.