Review Scan Results (Web UI)
This chapter is complementary to the Analyze Docker Image (Web UI) tutorial, and the output included here represents the generated results of the tutorial’s pipeline run. The goal here is to guide you on how to understand and review your scan results using the ScanCode.io web interface.
Tip
As a pre-requisite, follow the Analyze Docker Image (Web UI) tutorial to have a better understanding of the information included here.

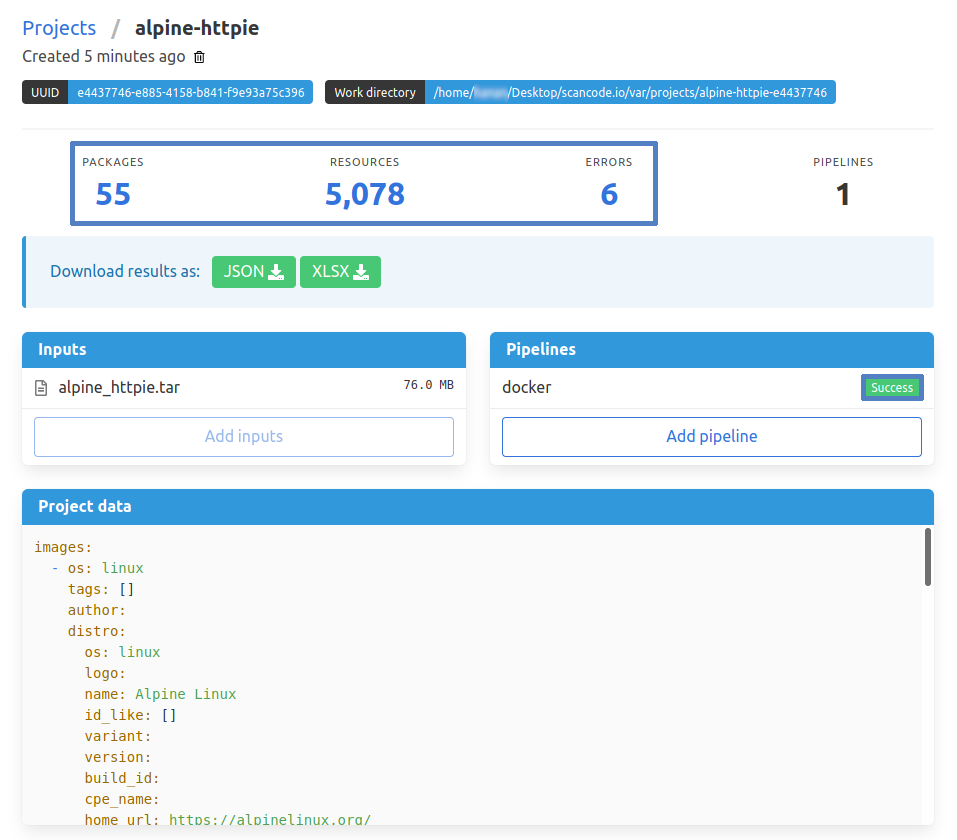
On the homepage, you can click on the project name in the summary table to access a detailed project output page. You can also click any of the numbers underneath the Packages, Resources, or Messages fields to be directed to the field’s corresponding information. Further, clicking on the pipeline’s execution status —Success in this case— expands some extra pipeline details, Resources status, and Run log.
Note
You can also view output-related information, in graphical representation, in each project page. Plus, other project data and input details.
In general, the output of any pipeline run includes details about:
Packages
A summary of Discovered Packages in a graphical format is shown in the project page that includes two Pie/Doughnut charts, which filter all packages found by their Type and License Expression:
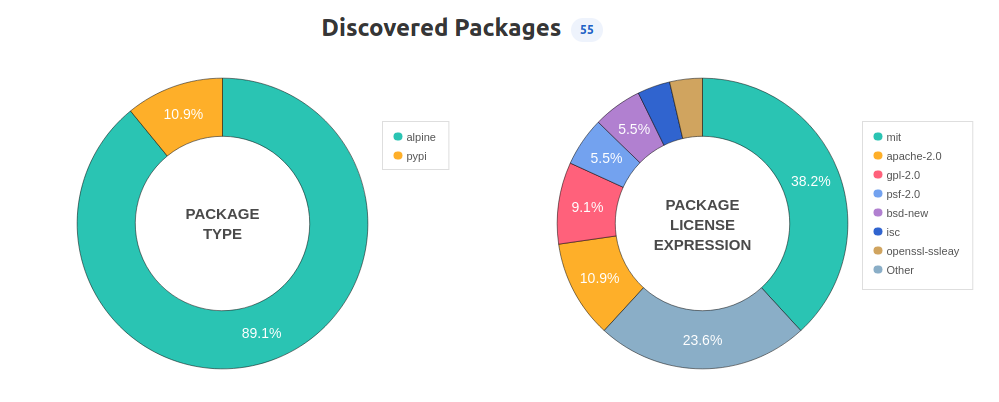
The two circular charts are interactive and can be filtered further by clicking any of the categories—Type and License Expression—on the right of each graph. Also, you can expand more details about any category separately, in tabular format, when you click its corresponding slice colour.
In addition, there is also an overall detailed table that includes all packages found and code resources within each package, which can be accessed by clicking on the Packages number field.
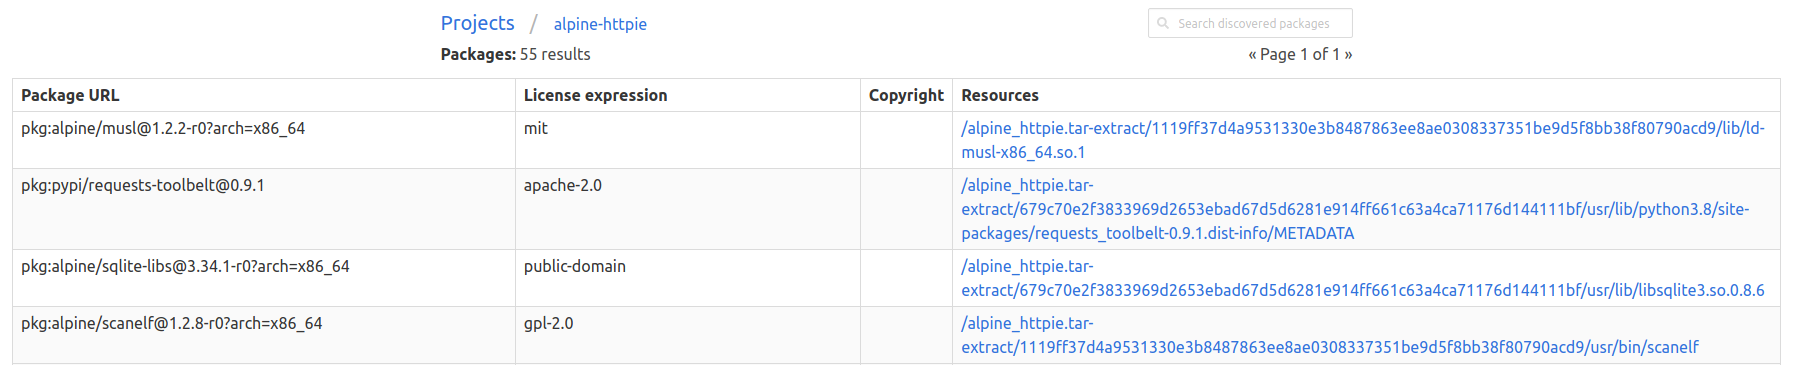
Resources
Similar to Packages, the total number of discovered Codebase Resources is shown on both ScanCode.io homepage and the “alpine-httpie” project page. Clicking on this number reveals a detailed table for all found code resources.
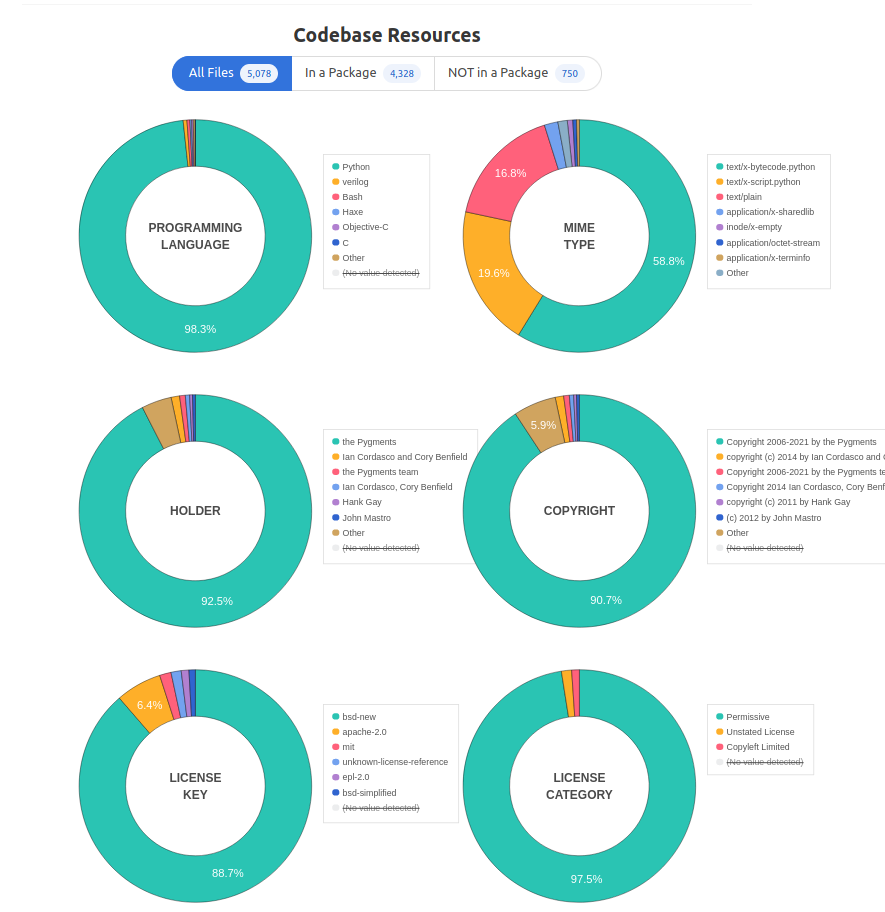
Further, the project page offers a group of Doughnut charts that filter code resources by Programming Language, Mime Type, Holder, Copyright, License Key, and License Category.
Note
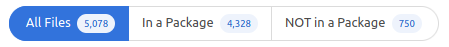
The charts above show all discovered Codebase files by default regardless of their existence within a package. You can still only view a subset, i.e., In a Package or Not in a Package
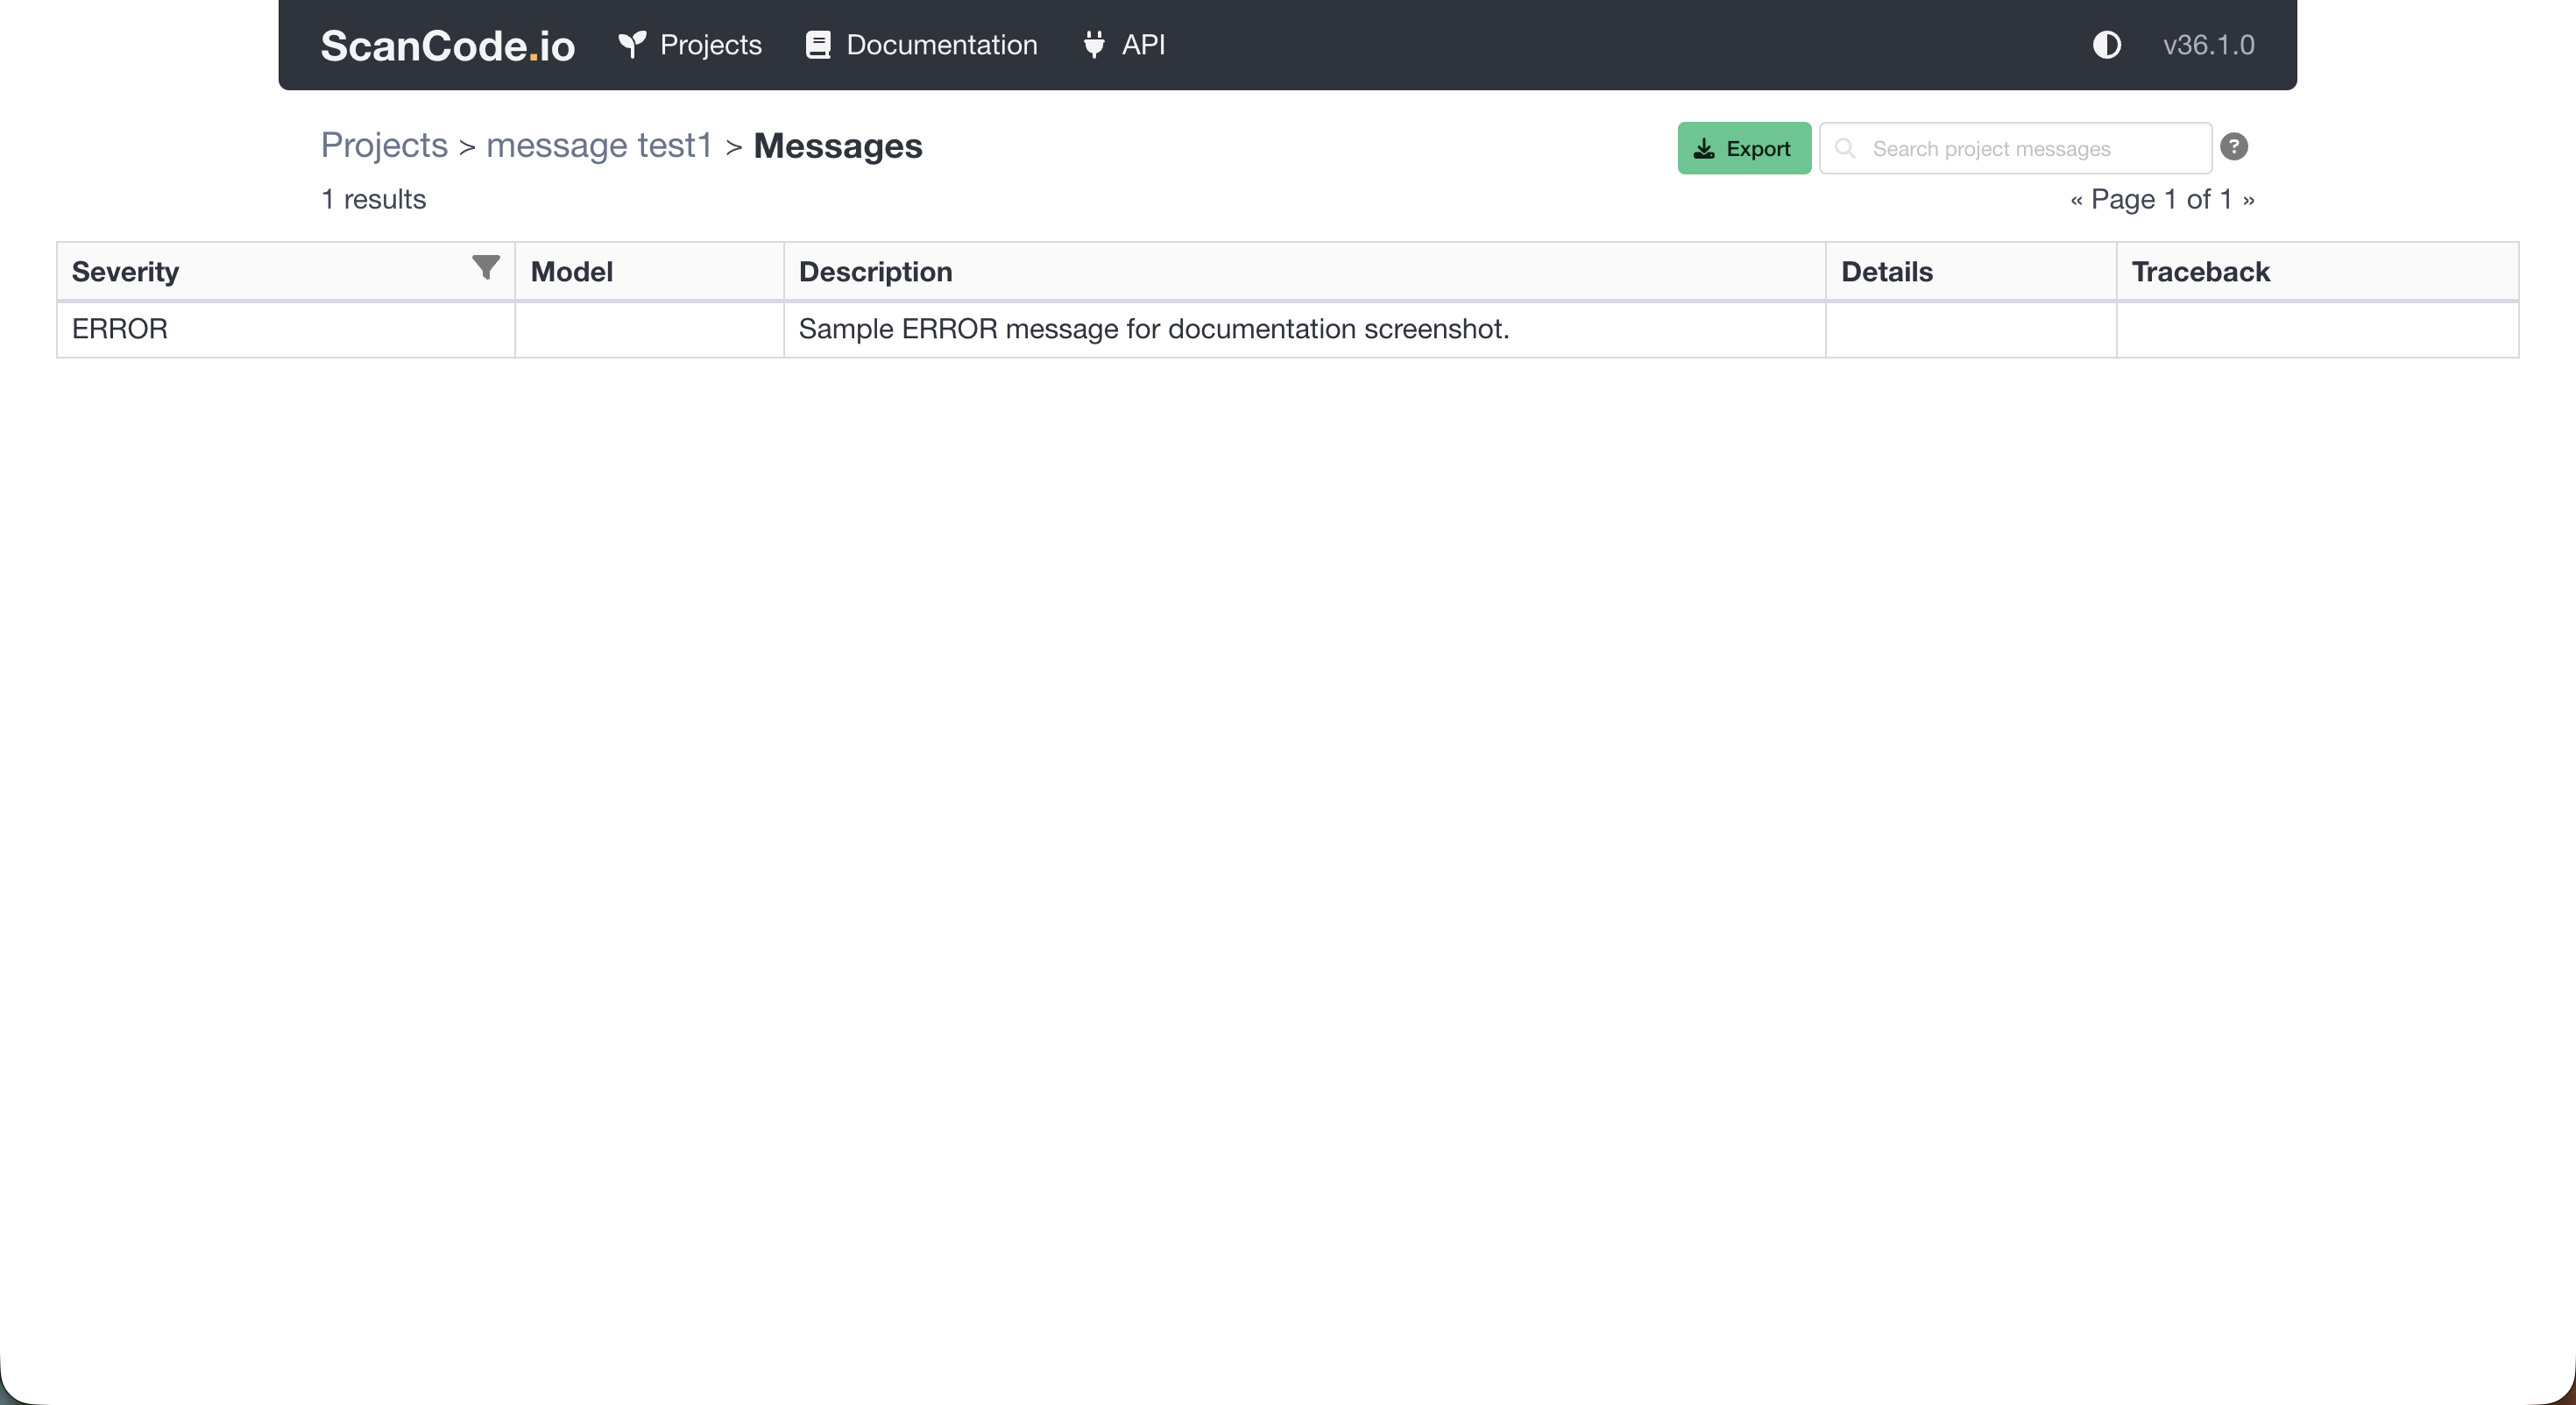
Messages
In addition to discovered packages and codebase resources, the ScanCode.io homepage shows the number of existing Messages, which you can click to view detailed information.
Messages can have different severity levels:
INFO
WARNING
ERROR
The “Messages” counter replaces the older “Errors” section used in previous versions of ScanCode.io. Project errors are now represented as messages with severity set to ERROR.
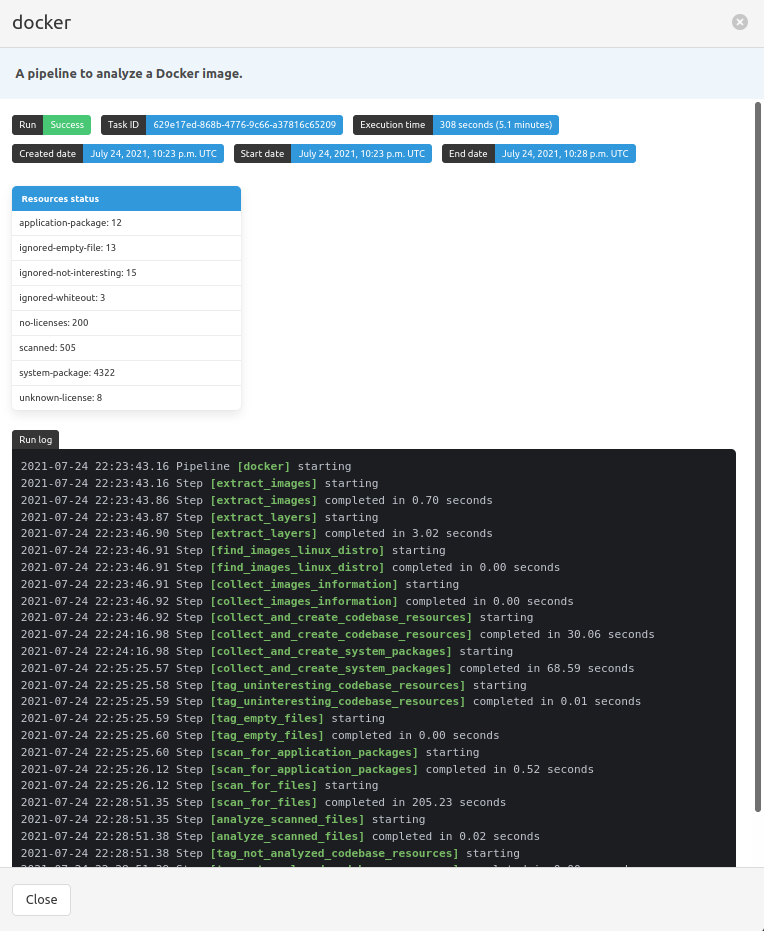
Other Information
Clicking on the pipeline’s execution status —Success in this case— opens a new window with some extra pipeline-specific details, such start and end date, launch, execution time and status, run log, etc.
Tip
The next tutorial chapter Analyze Docker Image (Command Line) will explore the interaction with ScanCode.io through a command line interface.